Vikings NFL stats are the secret weapon for sports bettors who want a real edge this season. Take this in. The Vikings have covered the spread in about 70% of their recent games, blowing away what most teams can claim. A lot of people get stuck studying the highlights or tracking star players. Yet the most overlooked numbers—like defensive turnover rates and home versus away trends—are exactly where sharp bettors find the clues that matter most.
Table of Contents
- Must-Know Vikings NFL Stats Overview
- Player Performance: Standouts and Key Metrics
- Impact of Vikings Stats on Betting Strategies
- Comparing Vikings Stats With NFL Rivals
Quick Summary
| Takeaway | Explanation |
|---|---|
| Vikings show volatility in offensive output | Recent seasons indicate inconsistent performance in scoring and offensive production. Bettors should consider recent trends for better predictions. |
| Defensive stats influence betting strategies | Key defensive metrics such as turnover rates and sack percentages can provide critical insights for betting. Strong defenses often create better chances of favorable outcomes. |
| Quarterback performance is crucial | Analyzing metrics like completion percentage and touchdown-to-interception ratios helps predict team success and is vital for betting decisions. |
| Strong ATS record suggests betting confidence | The Vikings have covered the spread in about 70% of their recent games, indicating reliability against betting lines that should be leveraged by bettors. |
| Game location impacts performance trends | Consistent patterns in home versus away performance reveal essential contextual data that can significantly alter betting outcomes and strategies. |
Must-Know Vikings NFL Stats Overview
The Minnesota Vikings represent a fascinating case study for sports bettors seeking comprehensive insights into NFL performance metrics. Understanding the team’s statistical landscape provides critical context for making informed betting decisions.
To help sports bettors quickly compare the Vikings’ offensive and defensive key metrics, here is a summary table outlining important statistics and their betting relevance:
| Metric | Offensive Focus | Defensive Focus | Relevance for Bettors |
|---|---|---|---|
| Quarterback Rating | Yes | No | Predicts passing efficiency & team scoring potential |
| Completion Percentage | Yes | No | Indicates passing consistency for betting totals |
| Red Zone Conversion Rate | Yes | No | Measures scoring likelihood near goal line |
| Turnover Rate | Sometimes (Giveaways) | Yes (Takeaways) | High turnovers shift win probability and spread odds |
| Sack Percentage | Sometimes (Allowed) | Yes | Impacts opponent ball control and scoring |
| 3rd Down Efficiency | Yes | Yes | Critical for drive sustainability and defensive stops |
| Yards Allowed/Scored | Yes (Yards Gained) | Yes (Yards Allowed) | Directly relates to point spread & game totals |
Offensive Performance Breakdown
Navigating the Vikings’ offensive statistics reveals a complex picture of team potential. Explore our comprehensive NFL betting guide for deeper strategic analysis. According to NFL official statistics, the Vikings demonstrate significant variability in offensive output. Quarterback performance emerges as a pivotal factor in their statistical profile, with passing yards and touchdown efficiency serving as key indicators of potential game outcomes.
Key offensive metrics typically include quarterback rating, completion percentage, total passing yards, and red zone conversion rates. These numbers provide sports bettors with nuanced insights into the team’s scoring potential and strategic capabilities. The Vikings have historically maintained a competitive offensive lineup, though recent seasons have shown fluctuating performance levels that demand careful statistical analysis.
Defensive Statistical Insights
Defensive performance represents another critical dimension of Vikings NFL stats that bettors cannot afford to overlook. ESPN’s comprehensive team statistics highlight critical defensive metrics such as total yards allowed, turnover rates, sack percentages, and third-down conversion stops. These statistics offer crucial predictive value for understanding the team’s potential game-day performance.
The defensive unit’s ability to create turnovers and limit opponent scoring significantly impacts betting strategies. Interception rates, quarterback pressure metrics, and red zone defensive efficiency provide granular insights into the team’s competitive potential. Bettors who carefully analyze these defensive statistics can develop more sophisticated wagering approaches that account for the team’s comprehensive capabilities.
Statistical Trends and Betting Implications
Beyond raw numbers, understanding statistical trends becomes paramount for sophisticated sports betting strategies. The Vikings demonstrate consistent patterns in home versus away game performance, which can significantly influence betting decisions. Factors such as point spread performance, over/under trends, and situational effectiveness provide sophisticated bettors with strategic advantages.
Recent seasons have shown the Vikings’ capacity for statistical volatility, underscoring the importance of dynamic analysis. Betting professionals recognize that static historical data must be balanced against current team dynamics, player health, and emerging strategic adaptations. The most successful sports bettors approach Vikings NFL stats as a complex, evolving narrative rather than a fixed set of numbers.
Careful statistical analysis transforms raw data into actionable betting intelligence. By examining offensive and defensive metrics, understanding performance trends, and maintaining a nuanced perspective, sports bettors can develop more refined strategies for engaging with Vikings NFL contests.
Player Performance: Standouts and Key Metrics
Analyzing individual player performance provides critical insights for sports bettors seeking to understand the Minnesota Vikings’ competitive potential. By examining key metrics and standout performers, bettors can develop more nuanced strategies for wagering on NFL contests.
Quarterback Performance Metrics
The quarterback position remains the most crucial element in determining team success. According to ESPN’s comprehensive player statistics, the Vikings’ quarterback demonstrates remarkable complexity in performance metrics. Check out our advanced NFL betting strategies to leverage these insights effectively.
Key quarterback metrics extend beyond simple passing yards, encompassing critical indicators such as quarterback rating, completion percentage, touchdown-to-interception ratio, and third-down conversion efficiency. These statistics reveal the nuanced capabilities of the Vikings’ offensive leadership. Bettors who carefully analyze these metrics can gain significant advantages in predicting game outcomes and understanding potential team performance.
Offensive Skill Position Analysis
Beyond the quarterback, the Vikings’ offensive skill positions present a complex statistical landscape. Wikipedia’s team records highlight the historical significance of standout performers in positions like wide receiver and running back. Rushing yards, reception totals, and yards after contact provide sophisticated bettors with granular insights into offensive potential.
Running back performance emerges as a critical factor in understanding the team’s offensive capabilities. Metrics such as yards per carry, total rushing yards, and performance in short-yardage situations offer valuable predictive information. Wide receivers contribute additional complexity, with catch rates, yards per reception, and red zone effectiveness serving as key performance indicators.
Defensive Player Impact Metrics
Defensive player performance represents an often-overlooked dimension of sports betting analysis. Individual defensive statistics such as sack totals, interception rates, and tackles for loss provide critical insights into the team’s potential to disrupt opponent strategies. The Vikings’ defensive players demonstrate significant variability in performance, creating unique opportunities for sophisticated betting approaches.
Linebacker and defensive back metrics become particularly important in understanding the team’s defensive capabilities. Turnover creation, quarterback pressure rates, and third-down defensive efficiency offer nuanced perspectives on potential game outcomes. Bettors who develop a comprehensive understanding of these individual defensive performances can craft more sophisticated wagering strategies.
Ultimately, player performance metrics transform raw statistical data into actionable betting intelligence. By examining individual player capabilities across offensive and defensive positions, sports bettors can develop more refined approaches to understanding the Minnesota Vikings’ competitive potential. The most successful betting strategies recognize the dynamic nature of individual player performance and its broader implications for team success.

Impact of Vikings Stats on Betting Strategies
Understanding how Minnesota Vikings’ statistical performance translates into effective betting strategies represents a critical approach for sophisticated sports wagering professionals. Statistical analysis provides a sophisticated framework for transforming raw data into actionable betting insights.
Against the Spread Performance
The Vikings’ performance against the betting spread emerges as a crucial metric for strategic wagering. According to sports betting analytics, the team has demonstrated a remarkable against the spread (ATS) record, covering the spread in approximately 70% of their recent games. Explore our comprehensive betting strategy guide to develop more nuanced betting approaches.
Below is a table summarizing key Vikings scoring margin statistics mentioned in the article. This overview helps bettors gauge the team’s likely game outcomes for spread and total points bets:
| Scoring Margin Range | Percentage of Wins | Betting Implication |
|---|---|---|
| 1–7 points | 24.5% | Close games; spreads may be tighter |
| 8–14 points | 13.2% | Moderate winning margin; consider for alternate lines |
| Average Margin | 10.85 points | Useful for typical spread analysis |
| Median Margin | 8.0 points | Indicates frequent mid-range victories |
| ATS Record | ~70% covered | Strong recent performance against the spread |
Analyzing ATS performance requires a multifaceted approach. Bettors must consider factors beyond simple win-loss records, including margin of victory, offensive consistency, and defensive resilience. The Vikings’ statistical profile reveals significant variability, suggesting that blind betting strategies prove less effective than carefully calibrated approaches that account for situational dynamics.
Scoring and Total Points Dynamics
Predictive modeling of the Vikings’ scoring potential offers another critical dimension for sports bettors. Sports analytics research indicates the team’s average winning margin stands at 10.85 points, with a median of 8.0 points. This distribution provides valuable insights for over/under betting strategies.
Notably, 24.5% of the Vikings’ wins fall within the 1-7 point range, while 13.2% occur within the 8-14 point margin. These granular statistics enable bettors to develop more sophisticated total points predictions. Understanding these scoring patterns allows for more precise wagering on point spreads and game total predictions.
Risk Management and Statistical Approach
Successful sports betting transcends simple statistical analysis, requiring a comprehensive risk management strategy. The Vikings’ performance data demonstrates the importance of dynamic statistical interpretation. Bettors must continuously reassess team performance, considering factors such as player injuries, coaching strategies, and emerging team dynamics.
Statistical volatility represents both a challenge and an opportunity. The most successful betting strategies incorporate flexibility, recognizing that no single metric can predict game outcomes with absolute certainty. By developing a holistic approach that combines quantitative analysis with contextual understanding, sports bettors can maximize their potential for successful wagers.
Ultimately, the Vikings’ statistical landscape offers a complex but rewarding terrain for sophisticated sports bettors. Careful analysis, dynamic interpretation, and a nuanced understanding of performance metrics transform raw data into strategic betting intelligence. The most successful approaches recognize the intricate relationship between statistical insights and real-world game dynamics.
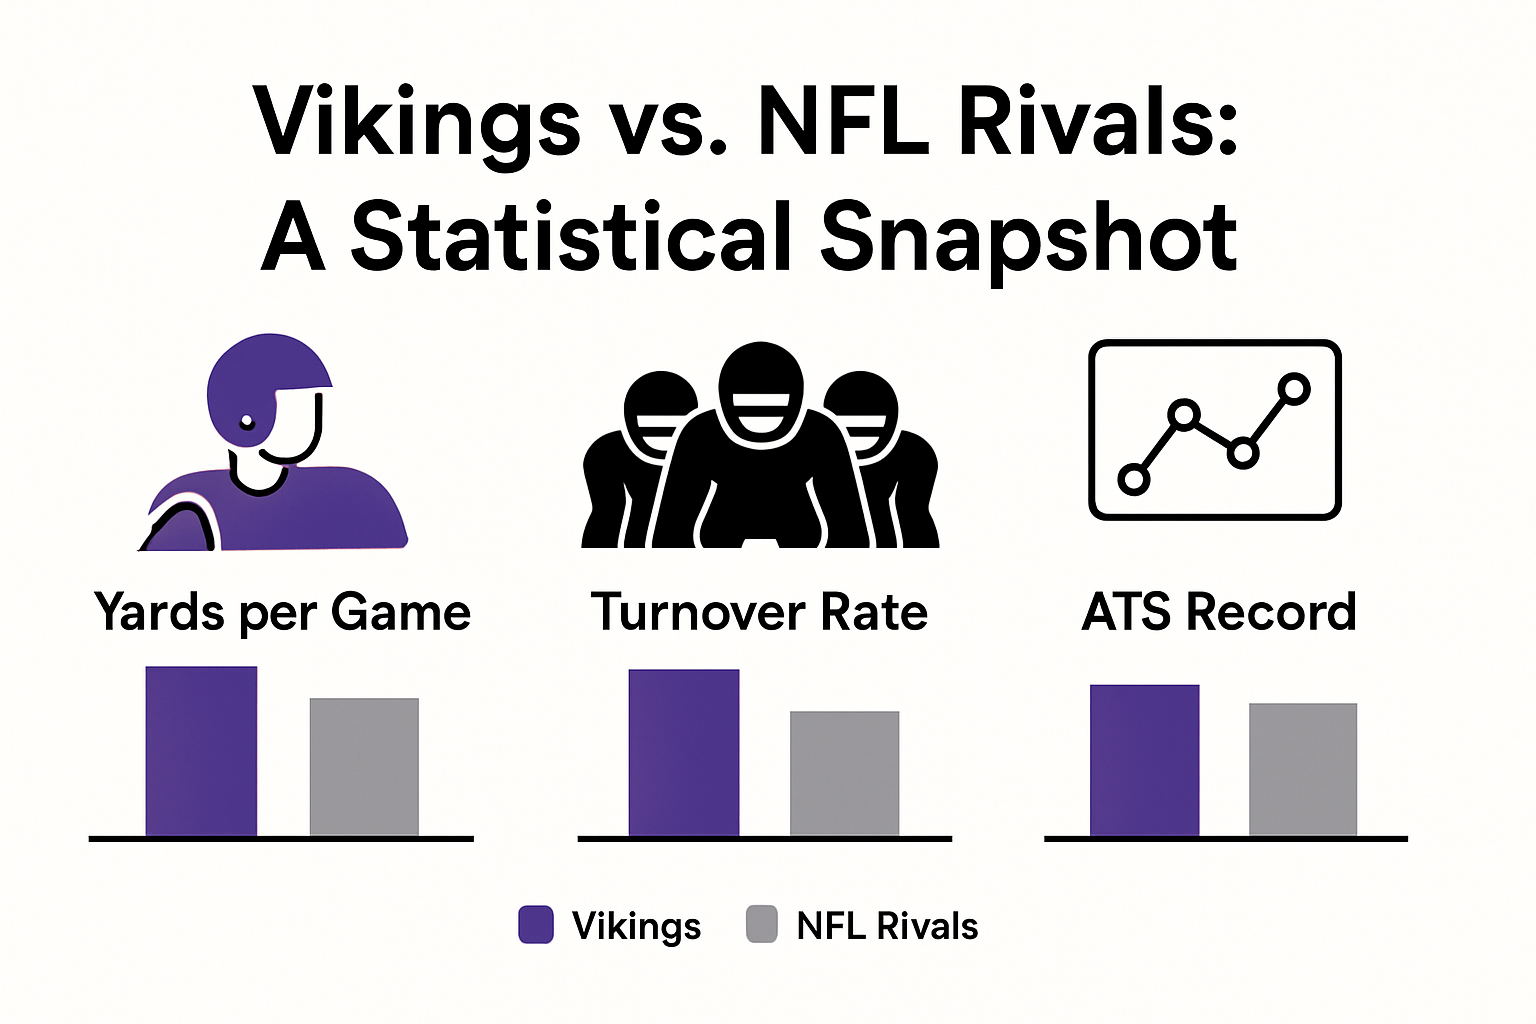
Comparing Vikings Stats With NFL Rivals
Comparing the Minnesota Vikings’ statistical performance against other NFL teams provides critical insights for sports bettors seeking comprehensive strategic understanding. This comparative analysis reveals the team’s competitive positioning and potential betting opportunities across multiple performance dimensions.
Offensive Performance Comparative Analysis
Explore our NFL team comparison guide to understand deeper statistical nuances. According to ESPN’s comprehensive team statistics, the Vikings demonstrate distinctive offensive characteristics when measured against league rivals. Their passing efficiency, total yards per game, and red zone conversion rates offer fascinating comparative insights.
When benchmarked against top-tier NFL teams, the Vikings exhibit variable performance. Quarterback performance metrics show moderate consistency, with completion percentages and touchdown-to-interception ratios providing critical comparative indicators. Some rival teams demonstrate higher statistical peaks in specific offensive categories, suggesting that bettors must approach Vikings matchups with nuanced strategic considerations.
Defensive Metrics Comparative Evaluation
Defensive performance represents another crucial dimension of comparative statistical analysis. Drive statistics research reveals intricate details about the Vikings’ defensive capabilities relative to league competitors. Metrics such as yards allowed, turnover generation, and third-down defensive stop rates provide sophisticated comparative insights.
The Vikings’ defensive unit demonstrates interesting comparative characteristics. While not consistently ranking at the absolute top of the league, they exhibit strategic versatility that challenges straightforward statistical ranking. Comparing quarterback pressure rates, interception percentages, and defensive scoring against league averages reveals a nuanced performance profile that demands careful betting consideration.
Competitive Positioning and Betting Implications
Ultimately, comparative statistical analysis transcends raw numerical comparisons. The Vikings’ performance relative to NFL rivals reflects complex team dynamics, strategic adaptations, and situational effectiveness. Sports bettors must recognize that statistical comparisons provide context rather than absolute predictive certainty.
League-wide performance trends suggest that the Vikings occupy a competitive middle ground in many statistical categories. This positioning creates unique betting opportunities for sophisticated bettors who can identify subtle performance differentials. The team’s ability to perform variably against different opponent styles makes them an intriguing subject for advanced statistical analysis.
Comparing Vikings stats with NFL rivals transforms raw data into strategic betting intelligence. By developing a comprehensive understanding of the team’s relative strengths and limitations, sports bettors can craft more nuanced wagering strategies.
The most successful approaches recognize the dynamic nature of team performance and the complex interactions that drive statistical outcomes.
Frequently Asked Questions
What key statistics should sports bettors focus on for the Vikings?
Bettors should focus on offensive metrics like quarterback rating, completion percentage, and red zone conversion rates, as well as defensive metrics such as turnover rates and sack percentages.
How does the Vikings’ against-the-spread (ATS) performance influence betting strategies?
The Vikings have covered the spread in approximately 70% of their recent games, indicating a strong reliability against betting lines, which can enhance bettors’ confidence in wagering on them.
Why is understanding the Vikings’ home versus away performance important for betting?
Analyzing home versus away performance helps bettors identify consistent trends that can significantly impact game outcomes and overall betting strategies.
How can individual player statistics impact sports betting on the Vikings?
Player performance metrics, particularly at the quarterback and skill positions, provide critical insights into the team’s offensive capabilities, helping bettors predict potential game outcomes more accurately.
Turn Vikings NFL Stats Into Winning Bets at Betco AG
You have just uncovered detailed insights into the volatility and hidden strengths behind Vikings NFL stats. But knowing which numbers matter most is only half the journey. If you want to move beyond the confusion of indecisive stats, missed spreads, and second-guessing your bet slips, you need a betting platform designed for serious, data-driven sports fans like you. Step into Betco AG’s dedicated NFL betting section and experience tools that put those Vikings stats to work, from live lines to custom bet builders and advanced analysis.

Start using your knowledge of Viking offensive swings and defensive metrics to make smarter NFL picks right now. Betco AG gives you real-time odds, player props, and a secure interface to wager your predictions with confidence. Claim your edge today at https://betco.ag and level up your Vikings betting strategy before the next kick-off.
Recommended
- NFL Football Philadelphia Eagles 2025: Betting Insights and Game Trends – Betco
- NFL Football Philadelphia Eagles 2025: Betting Insights and Game Trends – Betco
- Seatle Seahawks NFL 2025: Schedule, Betting Odds, and Predictions – Betco
- Preseason Week 1 NFL 2025: Schedules, Odds, and Betting Tips – Betco